A recent research shows that we can quantify “Urban Quality” by combining public perception of beauty, comfort, safety and ambience with measurable urban features like greenery, shading, seating and pedestrian activity—helping cities design more human-centered spaces.
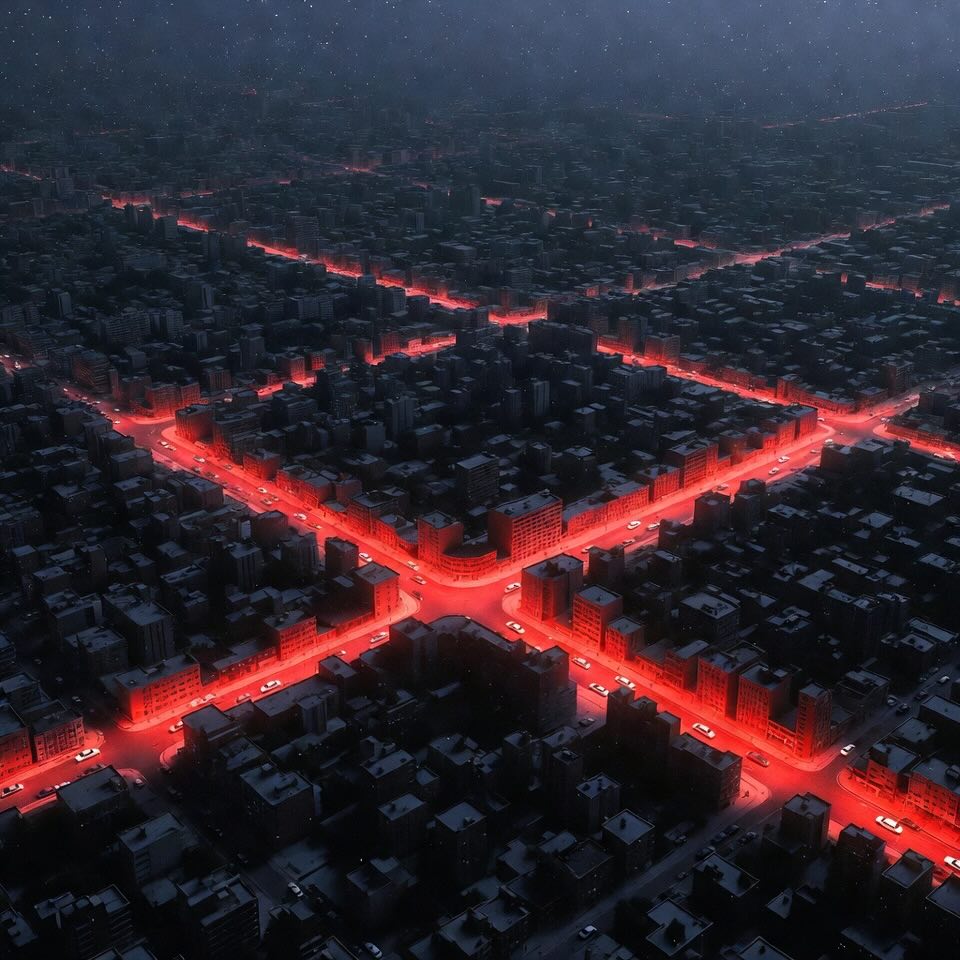
Have you ever walked down a street and instantly felt… wow, I love this place!
Or maybe the opposite — a wide, empty road that just feels uncomfortable or unsafe
That experience — that feeling — is called Urban Quality
But here’s the big engineering question:
Can we measure these feelings with numbers?
A 2025 research study from University of Technology Sydney explored exactly that!
It’s called:
“Quantifying Quality: Numerical Representations of Subjective Perceptions of Urban Space”
The goal? ➜ Turn people’s emotional reactions into quantifiable engineering data.
The researchers chose five qualities that shape how people experience the city:
| Trait | What it means |
|---|---|
| Beauty | Looks good visually |
| Comfort | Easy & pleasant to be in |
| Safety | Feels secure for pedestrians |
| Ambience | Enjoyable atmosphere, vibe |
| Character | Sense of uniqueness |
These qualities came from academic literature, planners, and place-making strategies in Sydney.
Instead of relying on Google Street View (which is vehicle-oriented), the team went out and photographed 174 real locations across 11 suburbs of Sydney:
Every photo was geo-tagged
Captured at eye level
Representing different neighborhood types
236 participants rated each location based on the 5 traits:
Good
Neutral
Bad
Demographics such as age, gender & location were collected too.
Younger people tended to be more positive about city spaces.
Older people were more neutral or negative.
The team used:
This helped quantify elements like:
Trees & greenery
Roads
Buildings & glass façades
Pedestrians
Seating
Shading
Cars (lots of cars usually ↓↓↓)
Street furniture
The result?
Every image got numeric values for real-world design features.
More than 100 geographic & demographic variables were mapped:
But here’s a twist
GIS data had weak correlation with people’s perception
Why? Spatial context ≠ What the photo shows!
Urban Quality = what you actually see + how it makes you feel
Based on the highest-ranked images:
And what makes a space feel BAD?
Here’s the mentality:
If a place is built for cars, humans will feel unwelcome.
If a place is built for people → humans thrive.
| Quality | Boosters in Urban Space | What to Avoid |
|---|---|---|
| Beauty | greenery, active façades, varied textures | blank walls, traffic clutter |
| Ambience | shade + people + mixed materials | open empty areas |
| Comfort | seating + shade + trees | heat, noise, exposure |
| Safety | good lighting, walkable paths, other pedestrians | isolation, car dominance |
These become numeric targets for designers.
Example: “Comfort = ≥17% trees + seating + shade features”
Most cities plan using technical data only: roads, density, zoning, property values…
But people live in cities emotionally.
This framework connects: Human perception + urban design metrics
Perfect for:
Imagine automated tools that say:
“Add 12% more tree cover to boost Comfort by 20%”
That’s the future this research pushes toward.
The study recognizes:
So future versions may include:
This research is a major step toward:
Soon, cities could measure how happy their streets make us — then redesign them to make us happier every day.
Great urban spaces are walkable, green, social and textured — and now, we can measure what makes them feel great!
Thanks to this research, Urban Quality is no longer a mystery — it’s a designable, optimizable engineering target.
Urban Quality - How well a city space supports people’s comfort, safety, enjoyment, and overall experience.
Urban Space - Any area in a city used by people — like streets, parks, plazas, sidewalks.
Subjective Perception - A personal feeling or opinion — how someone emotionally interprets a place.
Quantification - Turning feelings or observations into numbers that can be measured and compared.
Image Segmentation - A computer vision technique that divides an image into parts (trees, buildings, people, etc.) so we can measure what’s in it. - More about this concept in the article "ONCOPILOT: Redefining Tumor Evaluation with AI".
GIS (Geographic Information System) - A mapping tool that analyzes data tied to locations — used to understand patterns in space. - More about this concept in the article "Smart Tech Meets Climate Challenges | How GIS, Remote Sensing, and AI Are Saving Our Farms".
Pedestrian Viewpoint - Images or observations taken from the height and perspective of a person walking — not from a car.
Public Survey - A method where real people give feedback or ratings to help collect subjective opinions. - More about this concept in the article "Bridging the Equity Gap in Urban Transportation".
AI Object Detection - A machine learning model that identifies and counts objects (like cars or trees) in images. - More about this concept in the article "Smarter Helmet Detection with GAML-YOLO | Enhancing Road Safety Using Advanced AI Vision".
Walkability - How easy, pleasant, and safe it is to walk in an area — a big factor of urban experience.
Active Façades - Building fronts with storefronts, cafés or windows that create life and interaction facing the street.
Correlation - A statistical relationship — if one thing increases or decreases when another does.
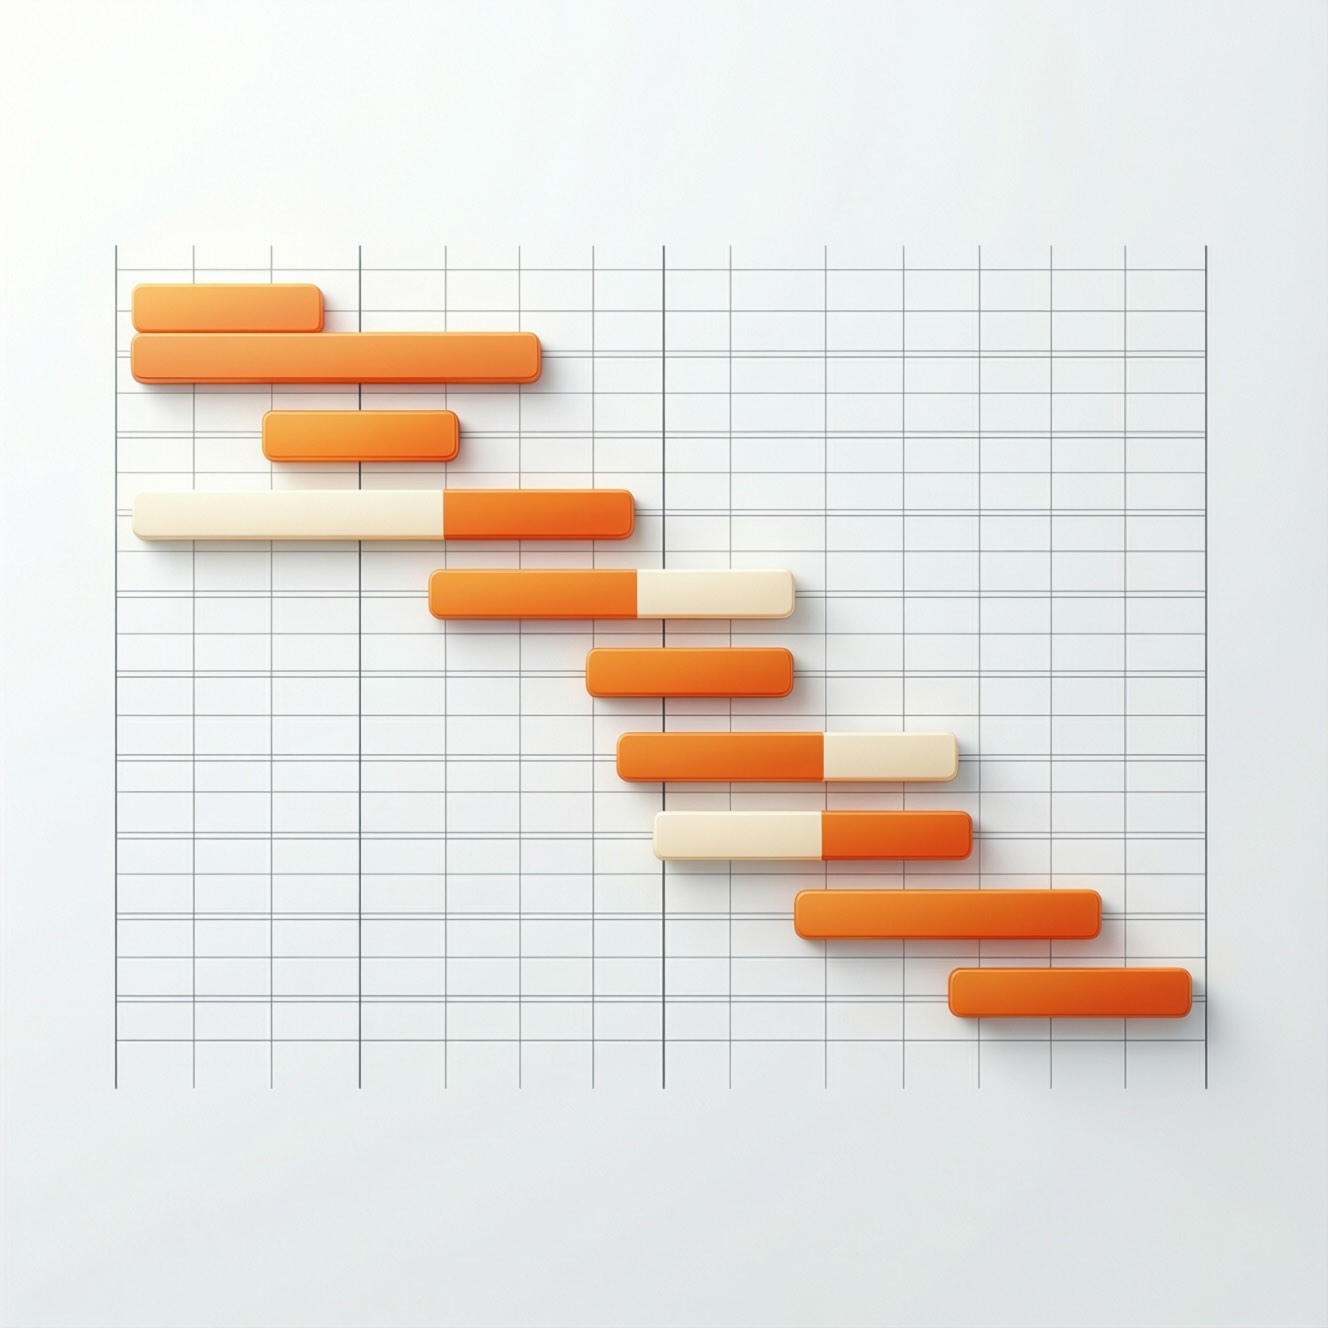
Pareto Ranking / Pareto Front - A method used to find the best options when there are multiple competing goals — like balancing beauty and safety at once. - More about this concept in the article "AUV Solar Optimization | The Next Wave in Marine Robotics".
Makki, M.; Mathers, J.; Matthews, L.; Biloria, N.; Melsom, J.; Cheung, L.K.; Ricafort, K.; Raymond, B.; Hannam, M. Quantifying Quality: Numerical Representations of Subjective Perceptions of Urban Space. Urban Sci. 2025, 9, 460. https://doi.org/10.3390/urbansci9110460
From: University of Technology Sydney; SJB.