A recent research presents a novel, high-precision method for assessing urban flood risk by integrating improved structural equation modeling (ISEM) with extensible matter-element analysis (EMAM), enhancing accuracy by 23.69% through comprehensive analysis of hazard, exposure, vulnerability, and shelter capacity factors.
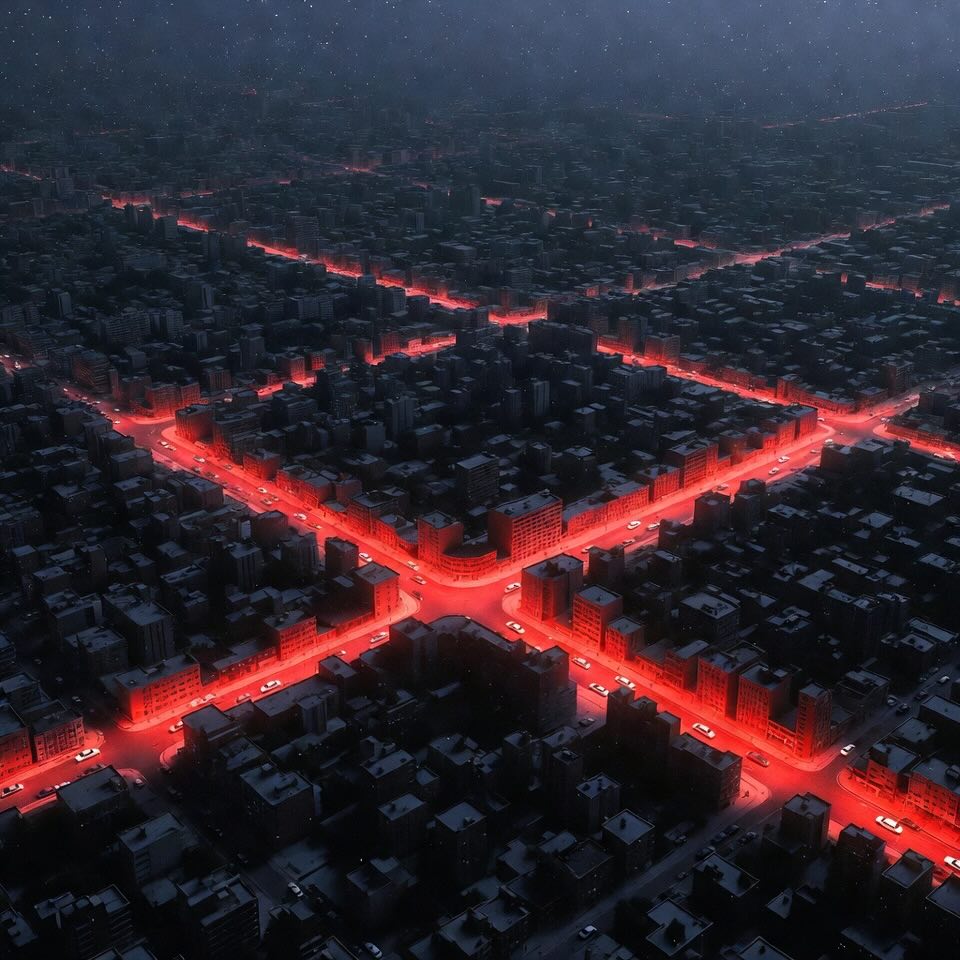
As climate change pushes cities to their limits, urban floods are becoming more common—and more dangerous. In places like China’s Liwan District of Guangzhou, torrential rains are turning streets into rivers, threatening lives and infrastructure alike. But what if we could predict the flood risks of a city with pinpoint accuracy?
A brand-new research study has done just that! Using Improved Structural Equation Modeling (ISEM) and Extensible Matter-Element Analysis Method (EMAM)—yes, they sound complex, but don’t worry, we’ll explain them—scientists have crafted a high-precision way to assess flood risks and make better city planning decisions.
Urban flooding isn't just an inconvenience—it’s a major urban disaster. Roads flood, homes get destroyed, and economies are disrupted. Traditional ways of assessing these risks often fall short, especially in dense, complex urban environments. Cities need smart systems to predict where and how badly floods could hit.
That’s where this new method shines.
This study combines two powerful methods:
Think of this as a smarter way to give weights to different flood risk factors. For example: Should we worry more about rainfall or poor drainage? Population or elevation? The model analyzes how all these factors relate and gets rid of overlaps.
ISEM includes:
EMAM is like a judge: it evaluates and ranks areas based on how risky they are. It handles all kinds of messy, fuzzy, real-world data and turns it into clear, ranked flood risk zones.
Together, these tools create a super-accurate flood risk map for cities.
This method was put to the test in the heart of Guangzhou—a 1 km² slice of the Liwan District, known for:
The model showed some eye-opening results!
These insights help decision-makers focus flood-prevention efforts where they’re needed most.
Here’s what makes it stand out:
While this study was localized to one district in China, the framework is universal. Cities everywhere—from Manila to Miami, Lagos to London—can adopt this method.
Urban floods are a rising threat, but we don’t have to stay one step behind. With tools like ISEM and EMAM, we can move toward resilient, flood-smart cities.
This research shows that engineering + data = real-world impact. It’s time we use that power to make our cities safer for everyone.
Stay tuned to EngiSphere for more cutting-edge engineering solutions from around the globe!
Urban Flood - Flooding that happens in city areas due to heavy rain, poor drainage, or overflowing rivers—often turning streets into streams.
Structural Equation Modeling (SEM) - A smart statistical method that finds and measures relationships between different factors—like a math detective for complex data.
Improved Structural Equation Modeling (ISEM) - A better version of SEM that avoids overlapping or confusing data by checking how related the factors really are—making results more accurate.
Pearson’s Correlation Coefficient - A math tool that tells you how strongly two things are connected (from -1 to 1)—like figuring out if rain always means more traffic. - More about this concept in the article "Revolutionizing Stock Predictions with GRU-PFG: Simplified, Accurate, and Scalable".
Indicator Weight - A number that shows how important a certain factor is in a model—kind of like scoring how much each ingredient matters in a recipe.
Extensible Matter-Element Analysis Method (EMAM) - A smart way to organize and compare fuzzy or complicated data to rank flood risks—like turning chaos into a clean checklist.
Hydrological–Hydrodynamic Model - A computer simulation that mimics how water moves through a city—like a video game that predicts floods in real-time.
GIS (Geographic Information System) - A tool that maps real-world data like elevation, roads, and buildings—used to see where floods might hit hardest. - More about this concept in the article "Building Smarter, Greener | Optimizing Modular Construction Supply Chains with AI & Multi-Agent Systems".
Exposure, Vulnerability & Hazard
Regional Shelter Capability - How well an area can protect people during floods—like having enough safe shelters and working drainage systems.
Yan, L.; Zhang, L.; Yang, W.; Chen, C.; Lin, J.; Chen, Z.; Jiang, X.; Liang, H.; Cong, P.; Gao, J.; et al. Research on Urban Flood Risk Assessment Based on Improved Structural Equation Modeling (ISEM) and the Extensible Matter-Element Analysis Method (EMAM). Water 2025, 17, 2025. https://doi.org/10.3390/w17132025
From: Guangdong Aike Environmental Technology Co.; Beifang Investigation, Design & Research Co.; Tianjin Chengjian University; Changchun Institute of Technology; Tianjin University; Agro-Environmental Protection Institute, China; Tongzhou District Water Authority of Beijing Municipality.