If you've ever managed a project—whether building a house, launching software, or planning an event—you know that keeping track of tasks, deadlines, and dependencies can feel overwhelming. Enter the Gantt chart: a visual project management tool that's been helping teams stay organized for over a century.
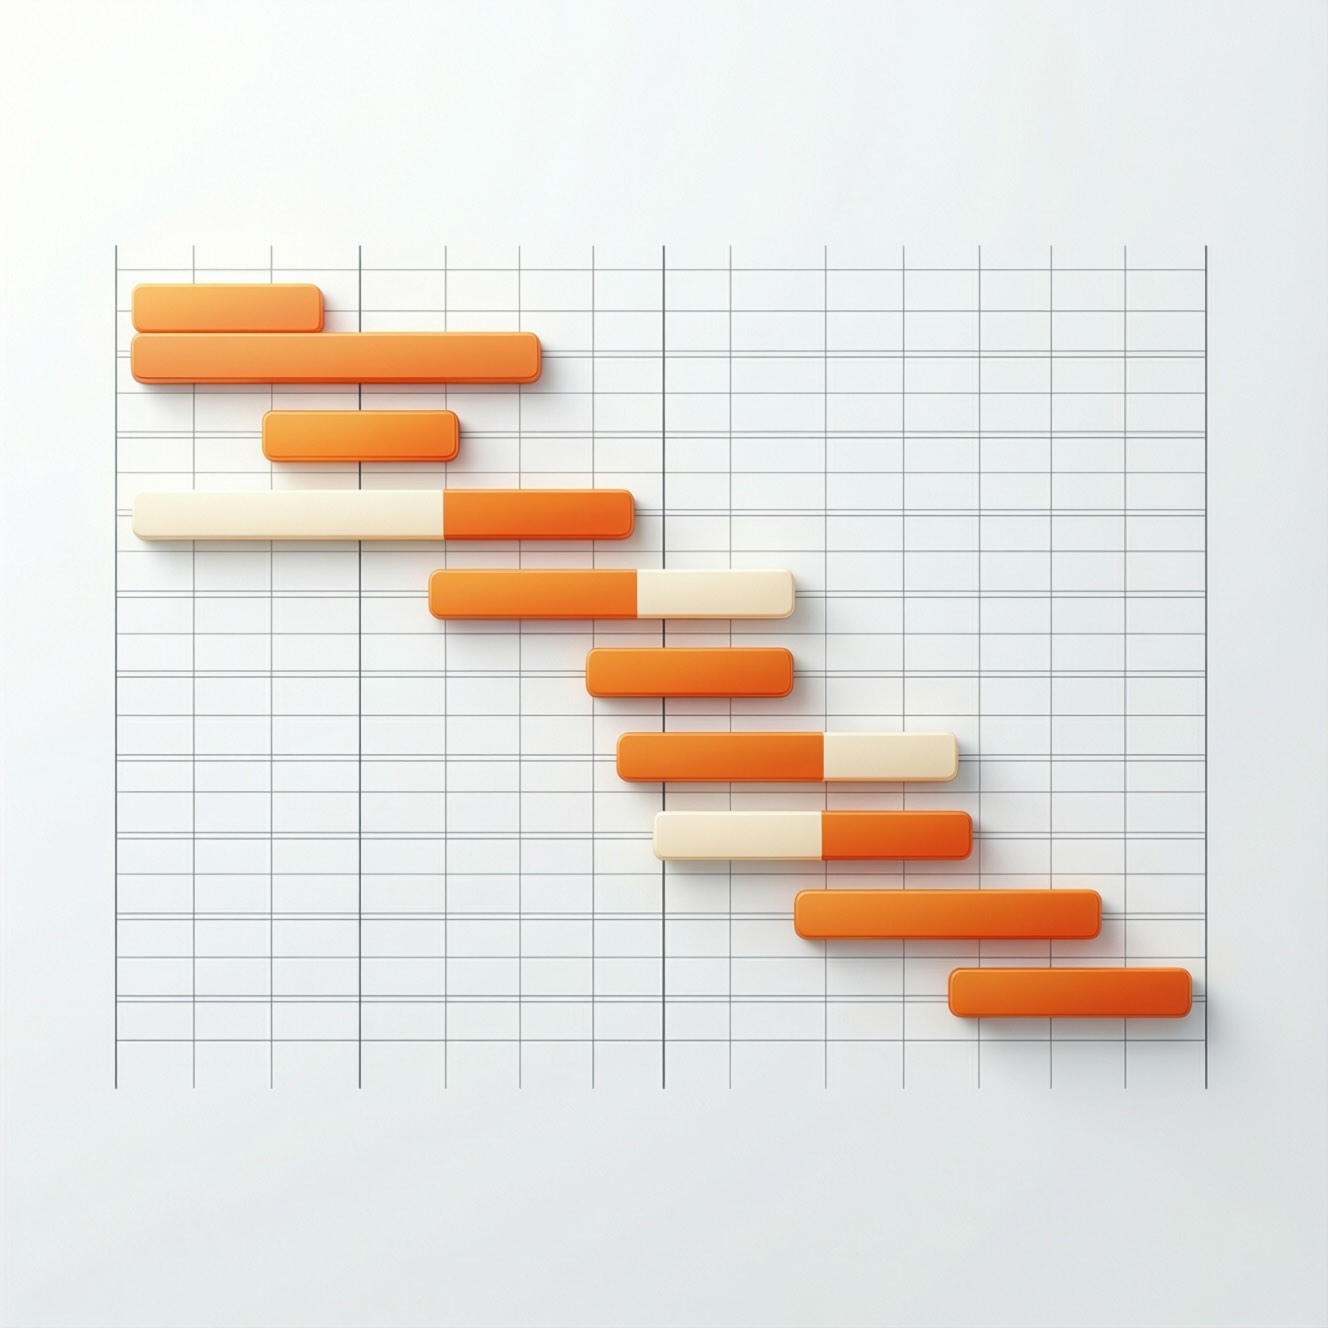
A Gantt chart is a horizontal bar chart that displays your project timeline. Each bar represents a task, showing when it starts, how long it lasts, and how it relates to other tasks. It's like a roadmap for your project, letting you see the entire journey at a glance.
Named after Henry Gantt, who popularized this technique in the 1910s for industrial projects, Gantt charts have evolved from hand-drawn diagrams to sophisticated digital tools. Today, they remain one of the most widely used project management visualizations worldwide.
Understanding Gantt charts theoretically is one thing—actually using them is where real learning happens. That's exactly why we built FlowGantt: to make project management education accessible to everyone.
Traditional project management software intimidates beginners with complex interfaces and expensive licenses. FlowGantt eliminates those barriers. No account required, no cost, no downloads—just open and start learning. Within minutes, you'll create your first professional Gantt chart.
Those critical path formulas we're about to explore? In FlowGantt, they calculate in real-time as you work. Add a dependency, and instantly see how it affects your project timeline. This immediate feedback transforms abstract concepts into intuitive understanding.
Every feature includes helpful tooltips explaining project management terminology. Our glossary panel provides instant definitions. The formula display reveals the mathematics behind the scenes. Pre-built examples from construction, software development, and event planning let you explore real-world scenarios.
Drag tasks, experiment with dependencies, watch the critical path recalculate. Break things, fix them, try again. This hands-on approach develops genuine project management intuition that reading alone cannot provide. Export your practice projects as images for coursework or portfolio building.
For students, educators, and professionals alike, FlowGantt transforms every interaction into an educational opportunity.
While Gantt charts look simple, they rely on solid mathematical foundations—specifically, the Critical Path Method (CPM). Let's break down how these calculations work.
The Critical Path Method uses four key calculations for each task:
ES = Maximum(Predecessors' Early Finish times)This tells you the earliest a task can possibly begin, based on when its prerequisite tasks finish.
EF = ES + Task DurationSimply add the task duration to its early start time.
LF = Minimum(Successors' Late Start times)Working backward from the project end, this shows the latest a task can finish without delaying the project.
LS = LF - Task DurationSubtract the task duration from its late finish time.
Float = LS - ES = LF - EFThis reveals your flexibility—how much you can delay a task without impacting the project deadline.
If Float = 0, then Task is on Critical PathTasks with zero slack form your critical path—the sequence that determines your minimum project duration.
Gantt charts support four types of task relationships:
These mathematical relationships ensure your project schedule remains logically consistent and achievable.
Here's how professionals use Gantt charts in real-world projects:
List every task required to complete your project. Break large tasks into manageable chunks.
Assign realistic time estimates to each task based on resources and complexity.
Identify which tasks depend on others. You can't paint walls before they're built!
Plot tasks on a calendar, respecting dependencies and constraints.
Calculate which tasks have zero flexibility—these demand your closest attention.
Ensure you have the right people and materials when each task begins.
Gantt charts aren't the only project management tool out there. Let's compare them to popular alternatives.
Kanban Strengths:
Gantt Advantages:
The Verdict: Use Kanban for ongoing operations (customer support, content creation). Choose Gantt for defined projects with specific end dates (construction, product launches).
PERT (Program Evaluation Review Technique) Strengths:
Gantt Advantages:
The Verdict: PERT excels when dealing with high uncertainty. Gantt wins for clearer communication and most standard projects.
Scrum Strengths:
Gantt Advantages:
The Verdict: Scrum thrives in dynamic environments where requirements evolve. Gantt charts excel when you need predictability and detailed planning.
Visual Clarity: One glance shows you where your project stands. Stakeholders love this transparency.
Dependency Tracking: You'll immediately see how delays ripple through your schedule.
Resource Planning: Allocate people and materials efficiently by seeing when tasks overlap.
Progress Monitoring: Compare planned vs. actual progress to catch problems early.
Communication Tool: Gantt charts speak a universal language that teams and clients understand.
Historical Record: Your chart becomes documentation of what happened and when.
Complexity Creep: Large projects can create overwhelming charts with hundreds of bars and dependencies.
Maintenance Burden: Updating a detailed Gantt chart requires consistent effort as reality diverges from plan.
False Precision: Detailed schedules can create an illusion of control when uncertainty is high.
Rigidity: Heavy upfront planning doesn't suit projects where requirements change frequently.
Learning Curve: Calculating critical paths and understanding slack requires training.
Software Dependency: Professional Gantt chart software can be expensive and complex.
Project management professionals consistently praise Gantt charts for their unmatched ability to communicate complex schedules to diverse audiences. Seasoned project managers note that while newer agile methodologies have gained popularity, Gantt charts remain indispensable for industries like construction, manufacturing, and infrastructure where sequential dependencies and fixed deadlines dominate.
However, experts caution against treating Gantt charts as rigid prediction tools. The most effective practitioners view them as living documents that evolve with the project. They recommend hybrid approaches—using Gantt charts for high-level planning while employing agile techniques for detailed execution.
Veterans also emphasize that the real value isn't in the chart itself but in the thinking it forces. The process of identifying dependencies, estimating durations, and finding the critical path reveals project risks and bottlenecks that might otherwise remain hidden until it's too late.
Modern project managers increasingly combine Gantt charts with other tools, leveraging each method's strengths. They might use Gantt for overall project scheduling while managing daily work through Kanban boards or sprint planning.
Gantt charts shine in these scenarios:
They're less ideal for:
The key to successful Gantt chart implementation isn't creating the perfect chart—it's creating a useful one. Start simple, focus on major milestones, and add detail only where it adds value. Update regularly, but don't obsess over minor variances.
Remember that Gantt charts are tools, not magic. They organize information and reveal relationships, but they can't compensate for poor planning, unrealistic estimates, or lack of team communication. Use them as one part of a comprehensive project management approach.
Whether you're a construction manager coordinating trades, a software lead planning a release, or an event organizer juggling vendors, understanding Gantt chart methodology gives you a powerful framework for turning complex projects into achievable realities.